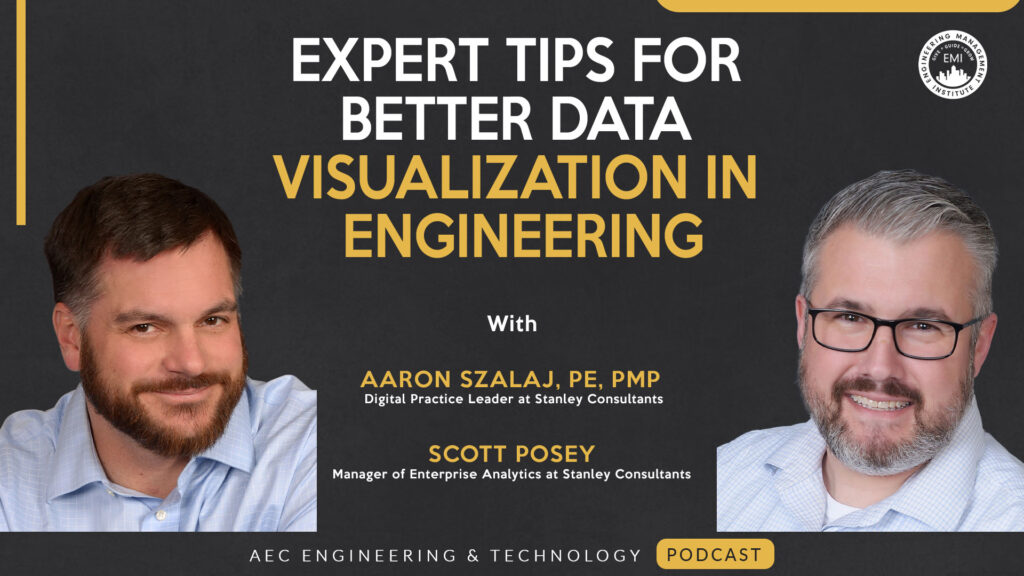
In this episode, I talk with Aaron Szalaj, PE, PMP, Digital Practice Leader, and Scott Posey, Manager of Enterprise Analytics at Stanley Consultants, about turning everyday data into smarter decisions using practical, scalable solutions and tools like Power BI to uncover insights and boost project outcomes through data visualization in engineering.
***The video version of this episode can be viewed here.***
Engineering Quotes:
Here Are Some of the Questions I Asked Aaron and Scott:
- How do you help clients choose the right data visualization or management tool, and what factors influence that decision?
- What should organizations focus on during a physical system audit to ensure they’re collecting the right data?
- What are some common data blind spots companies run into, and how can visualization tools help uncover them?
- What are the biggest mistakes companies make when trying to implement new data tools, and how can they avoid them?
- How do you bring together data from different systems into one platform like Power BI, and can you share a real-world example where this made a difference?
- How does cybersecurity play a role when selecting and setting up data tools?
- Can you walk us through a transportation project you worked on involving crash data and how data visualization in engineering helped achieve the goals?
- How can companies make smart data decisions even when they have tight budgets by using KPIs effectively?
- What advice would you give to someone just starting their data journey who wants to use visualization tools without getting overwhelmed?
Here Are Some Key Points Discussed in This Episode About Expert Tips for Better Data Visualization in Engineering:
- Each client starts their data journey at a different point, so the team builds solutions based on current tools and familiarity. By understanding needs and comfort levels, they guide clients toward platforms like Power BI or stick with Excel when it makes more sense.
- A proper audit checks if the organization collects the right data from the right sources and systems. This foundational step ensures that future visualizations deliver accurate insights and support smart decision-making.
- Blind spots often happen when valuable data lives in forgotten Excel files on someone’s computer. Visualization tools help uncover hidden sources and bring everything into one central place the entire team can access.
- One common mistake is expecting fast results without building the right foundation. Success depends on realistic planning, proper budgeting, and a clear understanding of the time needed to implement effective solutions.
- The team builds middle layers to connect systems that do not naturally communicate, frequently using custom archiving and unique identifiers. This approach helped one utility track real-time progress and financial data together in a single dashboard—demonstrating the impact of data visualization in engineering.
- Cybersecurity becomes critical when data is centralized, making it more accessible and more vulnerable. Teams work directly with IT departments to ensure all data systems follow secure policies from the beginning.
- Crash data from multiple sources was cleaned, mapped, and analyzed to identify dangerous intersections and conditions. The result gave transportation agencies a clear starting point for improving road safety in targeted areas using data visualization in engineering tools.
- Smart planning allows companies to phase their data efforts based on budget and key performance goals. Teams break the work into manageable steps that bring value over time without overwhelming resources.
- Start small with simple tools and solve one clear problem that brings quick results. As others see the impact, support builds naturally, and the data effort expands with less resistance—making data visualization in engineering a scalable strategy for long-term success.
More Details in This Episode…
About Aaron Szalaj, PE, PMP

About Scott Posey

Previously, Scott held key analytics roles at Remedi SeniorCare Pharmacy and AOL (Advertising.com), where he managed cross-functional teams, implemented enterprise BI platforms like Qlik Sense and SSRS, and supported executive leadership with data solutions. He is skilled in SQL, dashboard development, agile methodologies, and mentoring analytics teams.
Scott holds a B.S. in business information systems from Stevenson University and is based in Castle Rock, Colorado. He is also committed to community service, having volunteered with organizations focused on poverty alleviation.
About the Host: Nick Heim, P.E.

Nick’s interests lie at the intersection between the built world and technology, and he can be found looking for the ever-changing answer to the question, “How can we do this better?” Nick can be found on LinkedIn, producing content about the use of technologies in his civil engineering career and small business.
Sources/References:
Stanley Consultants
Power BI
Tableau
SharePoint
SCADA systems
Department of Transportation
Connect with Aaron Szalaj, PE, PMP, on LinkedIn
Connect with Scott Posey on LinkedIn
Please leave your comments, feedback, or questions in the section below.


